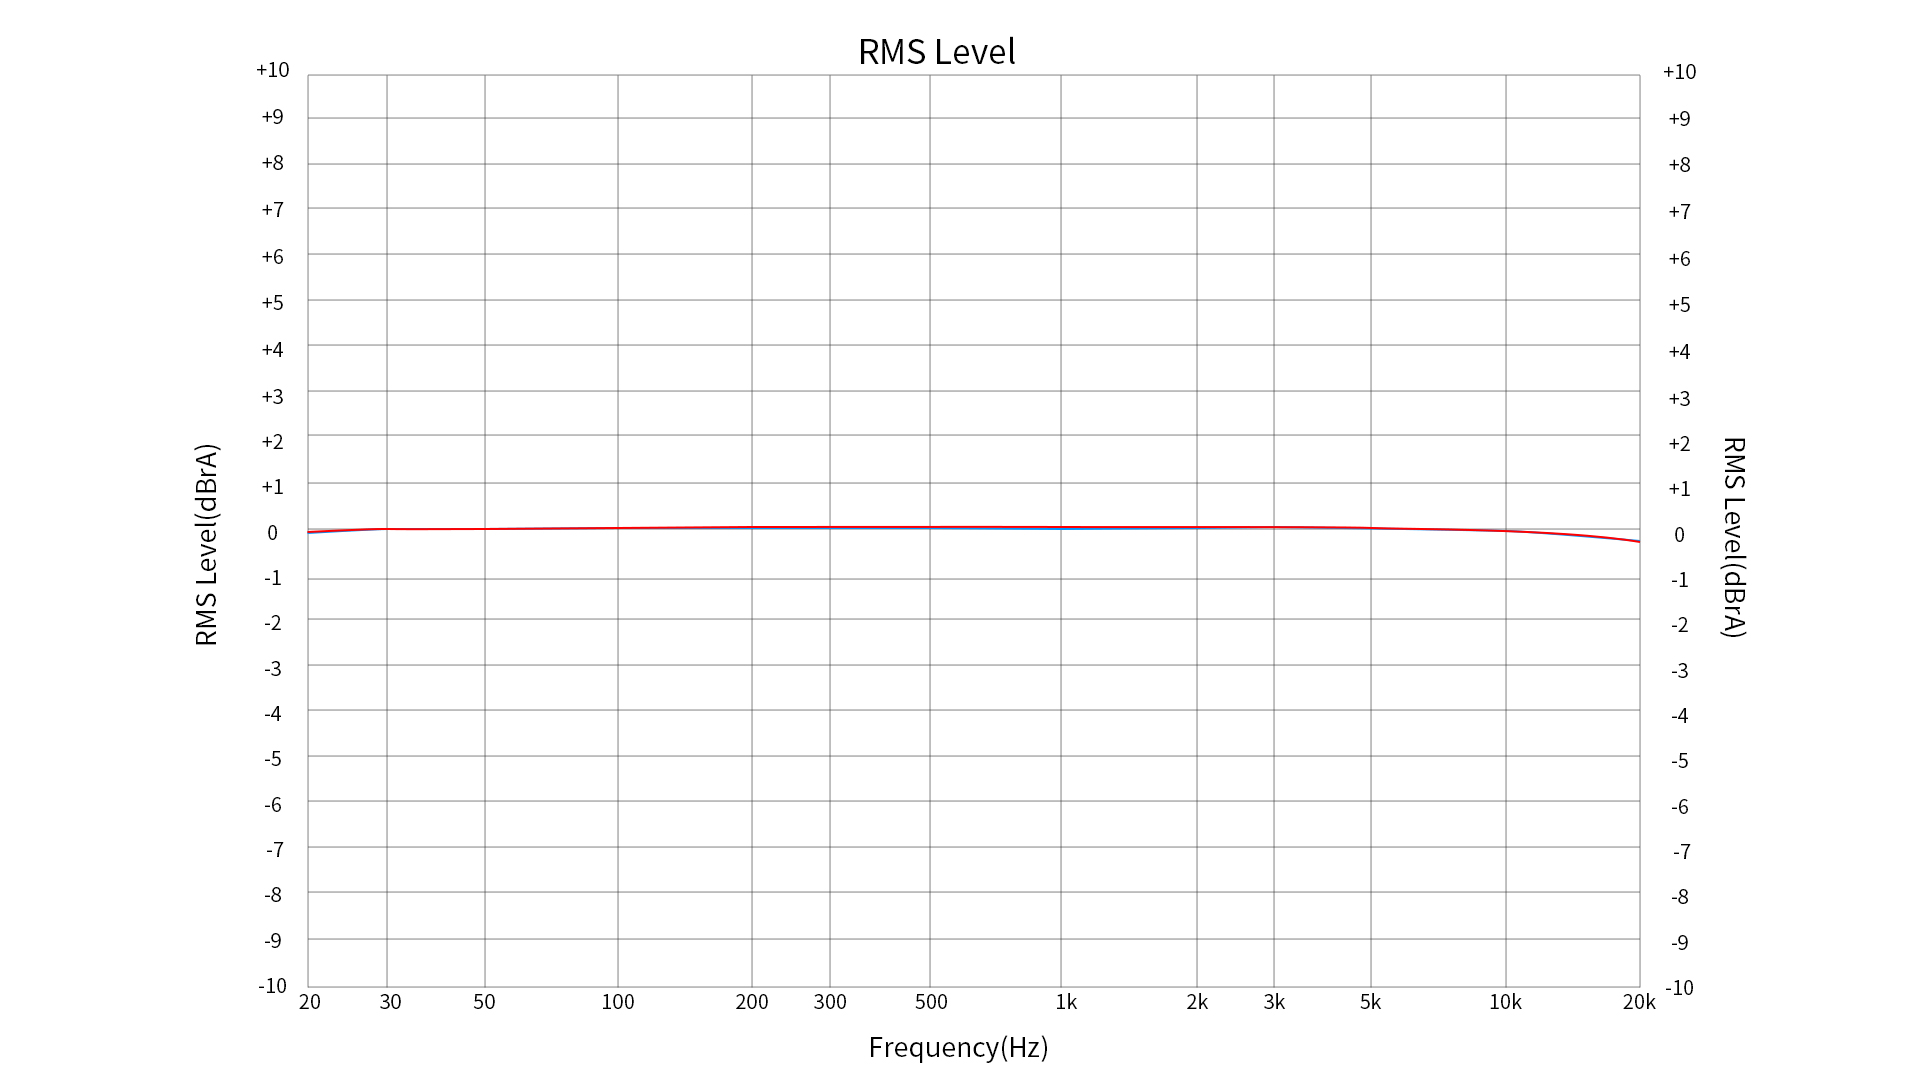
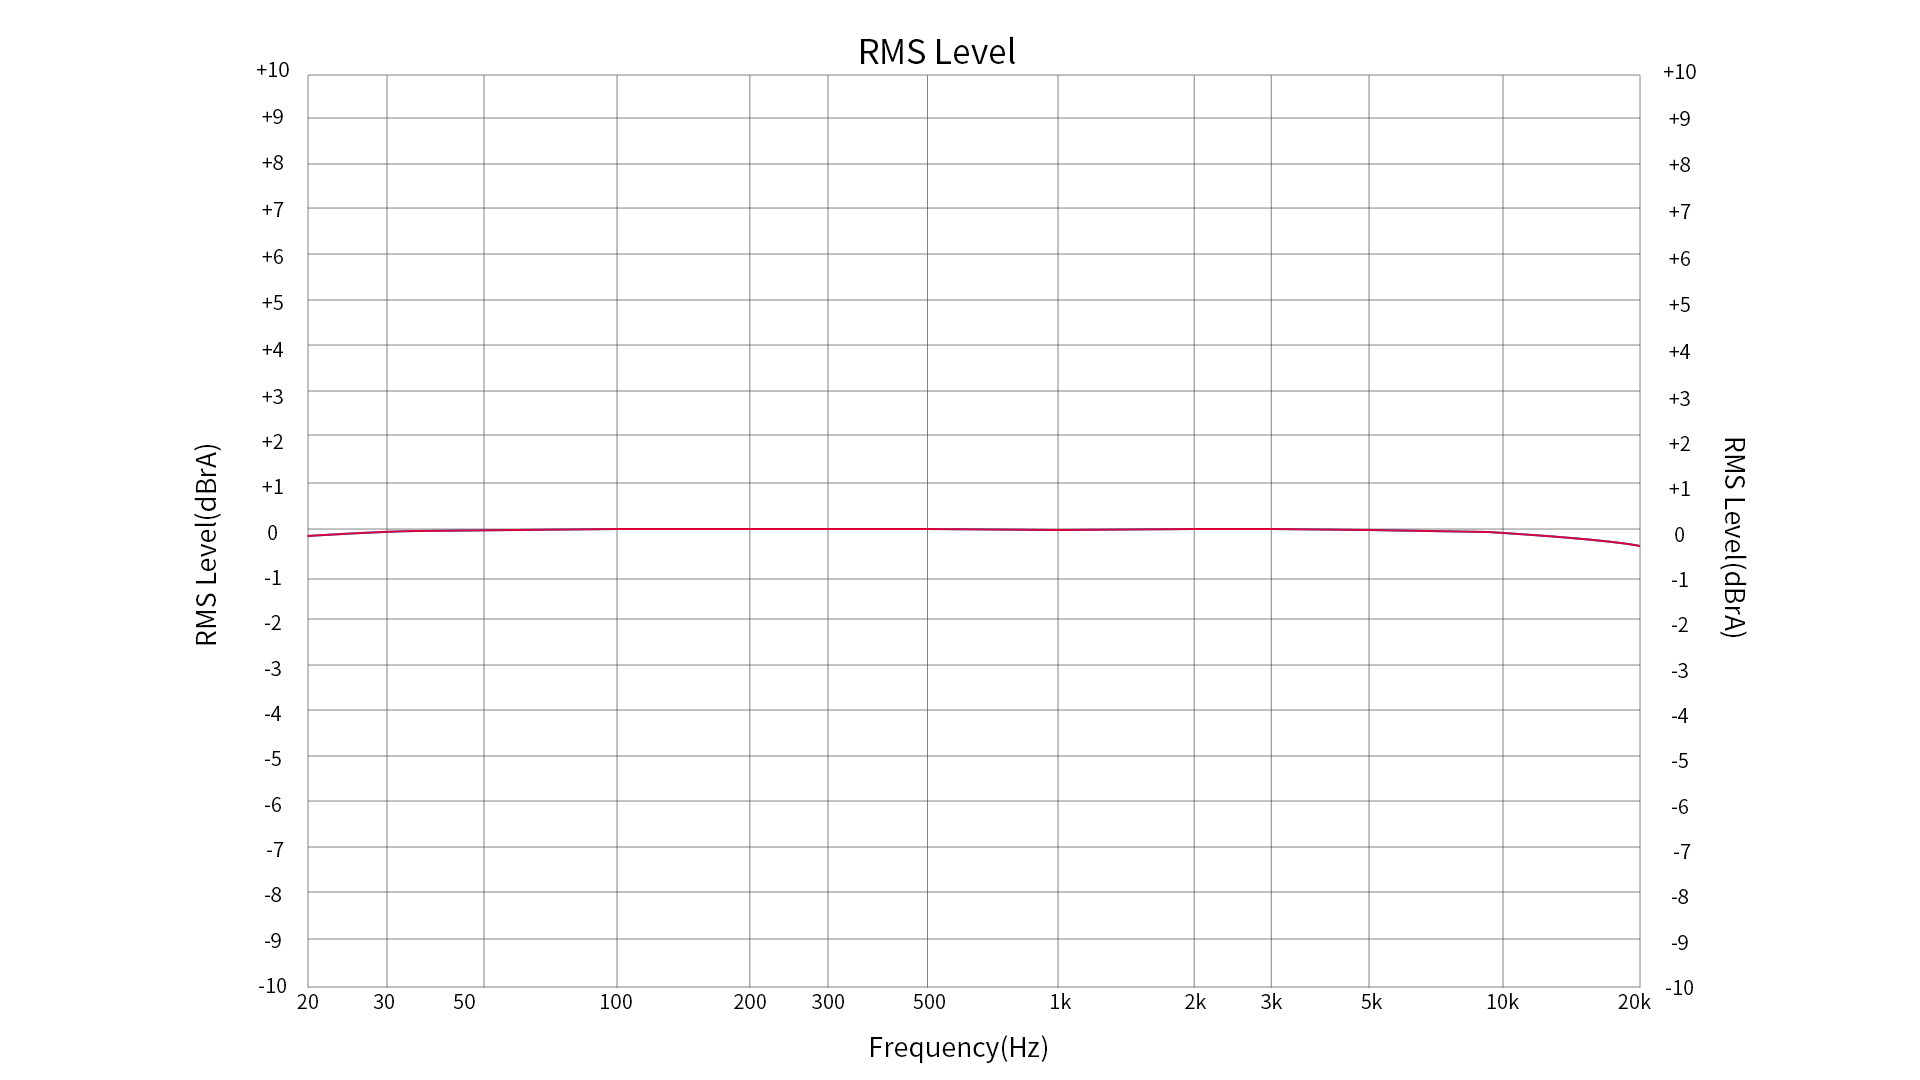
Frequency Response Curve 1
Test conditions: USB DAC input,-5dB sinusoidal signal, 20Hz-20kHz, headphone output (32 Ω load)
Red: left channel; Blue: right channel
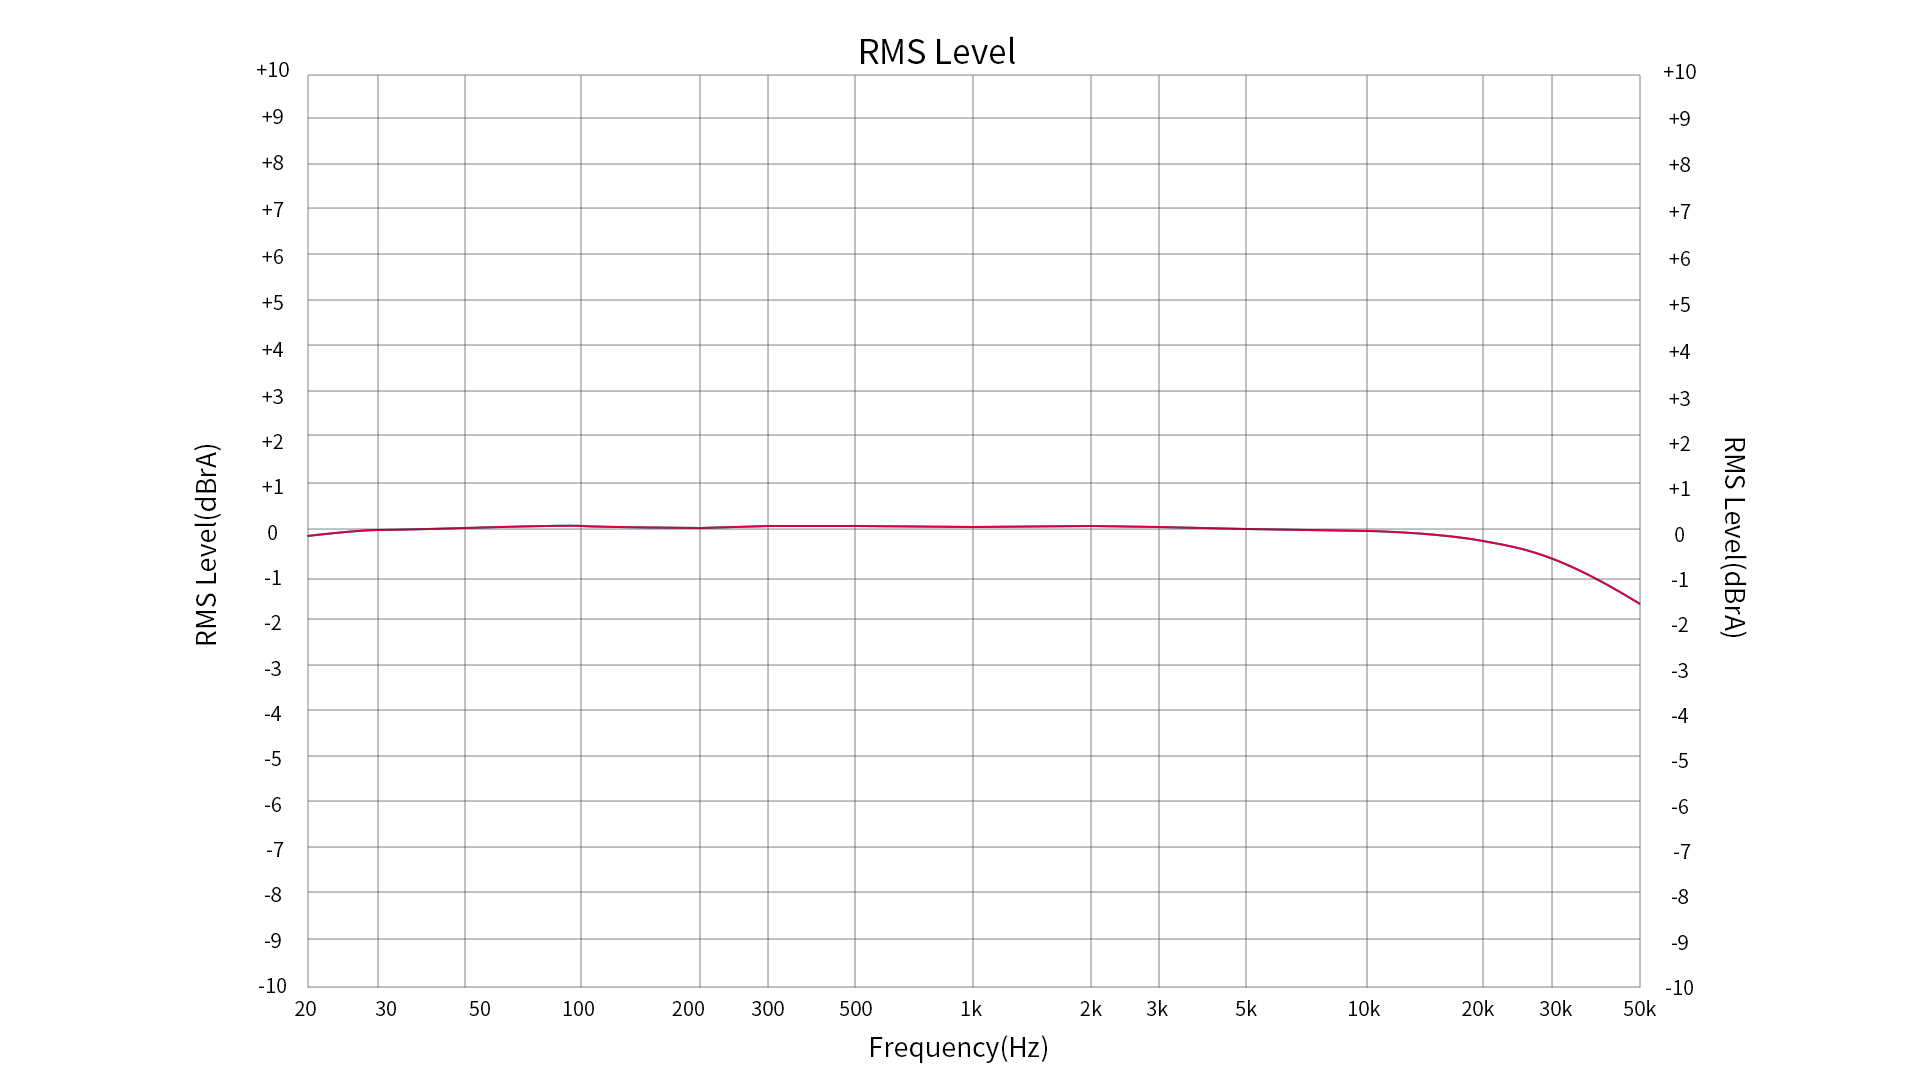
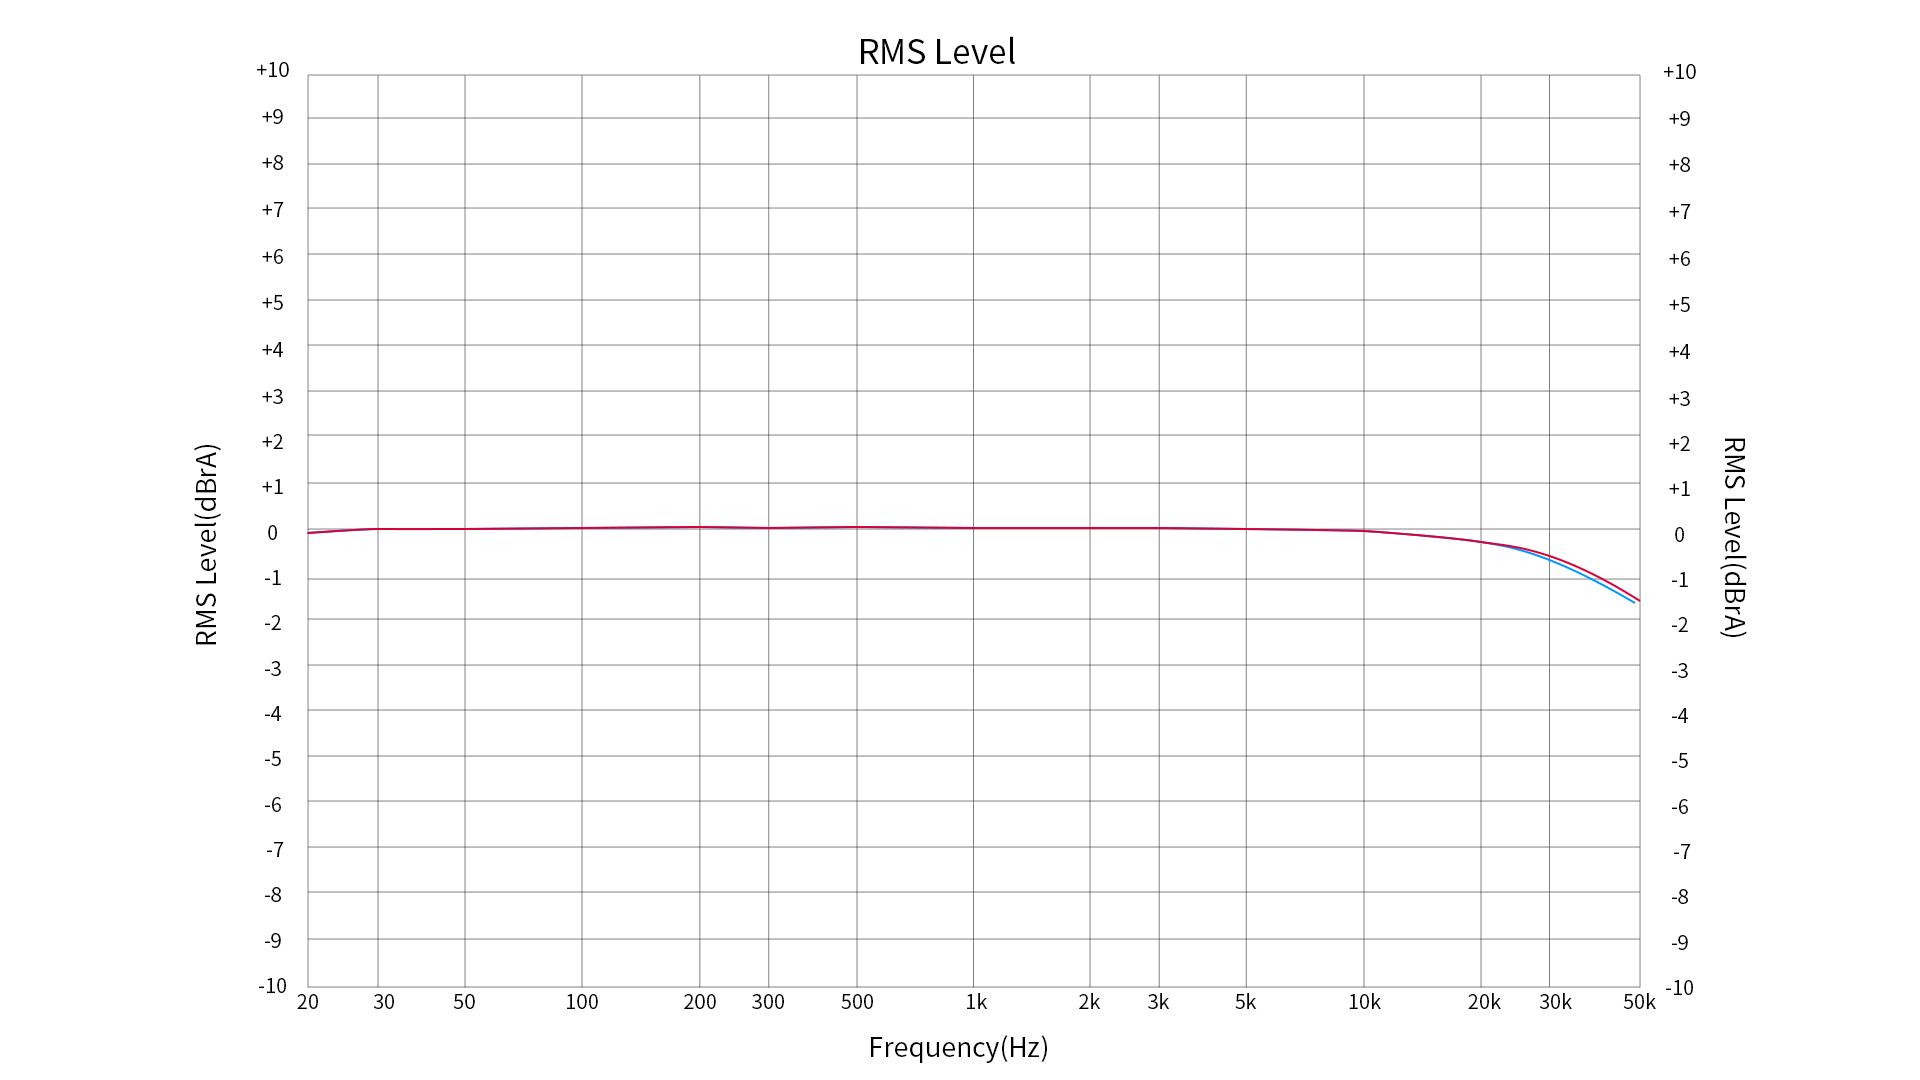
Frequency Response Curve 2
Test conditions: USB DAC input,-5dB sinusoidal signal, 20Hz-50kHz, headphone output (32 Ω load)
Red: left channel; Blue: right channel
Frequency Response Curve 3
Test conditions: USB DAC input,-5dB sinusoidal signal, 20Hz-20kHz, balanced output (32 Ω load)
Red: left channel; Blue: right channel
Frequency Response Curve 4
Test conditions: USB DAC input,-5dB sinusoidal signal, 20Hz-50kHz, balanced output (32 Ω load)
Red: left channel; Blue: right channel
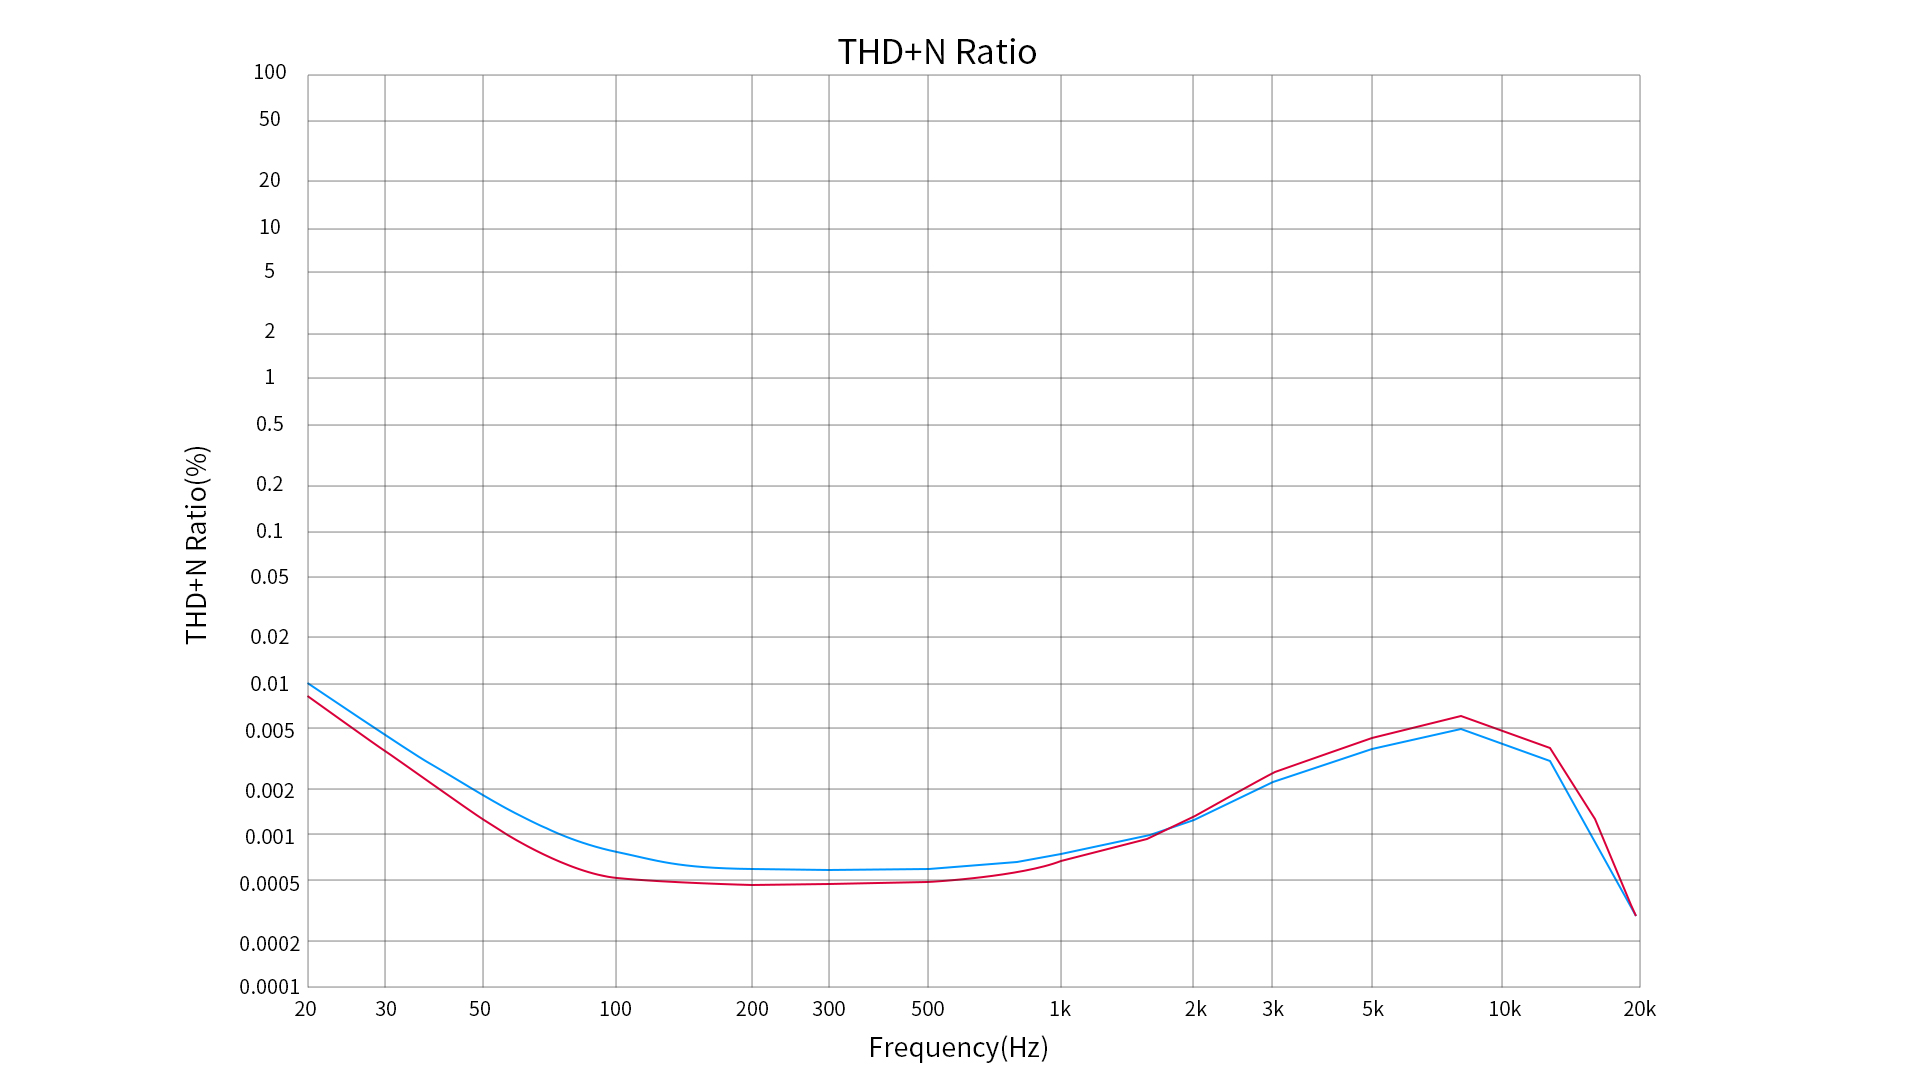
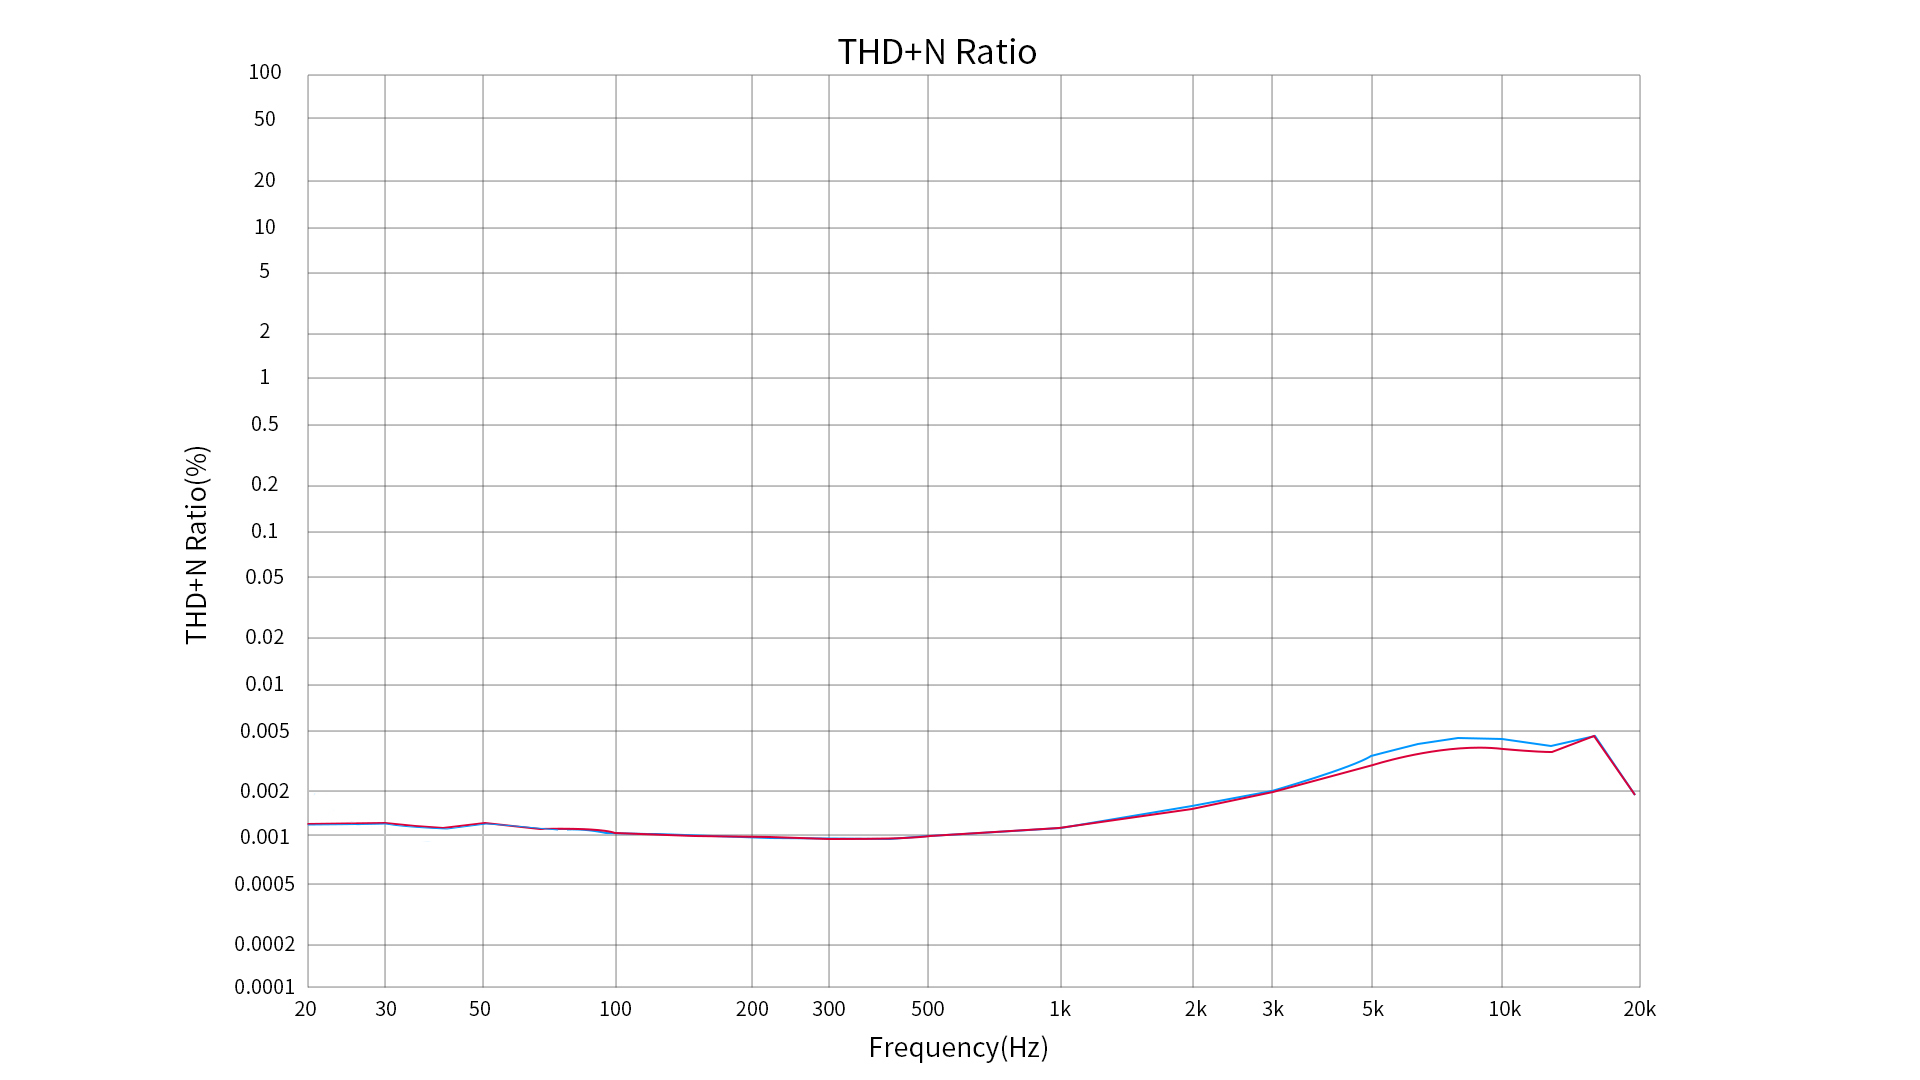
distortion plot 2
Test condition: USB DAC, play-2dB high gain sinusoidal signal, 20Hz-20kHz,BAL output (32 Ω load)
distortion graph 3
Test condition: USB DAC, play-2dB high gain sinusoidal signal, 20Hz-20kHz,BAL output (32 Ω load)
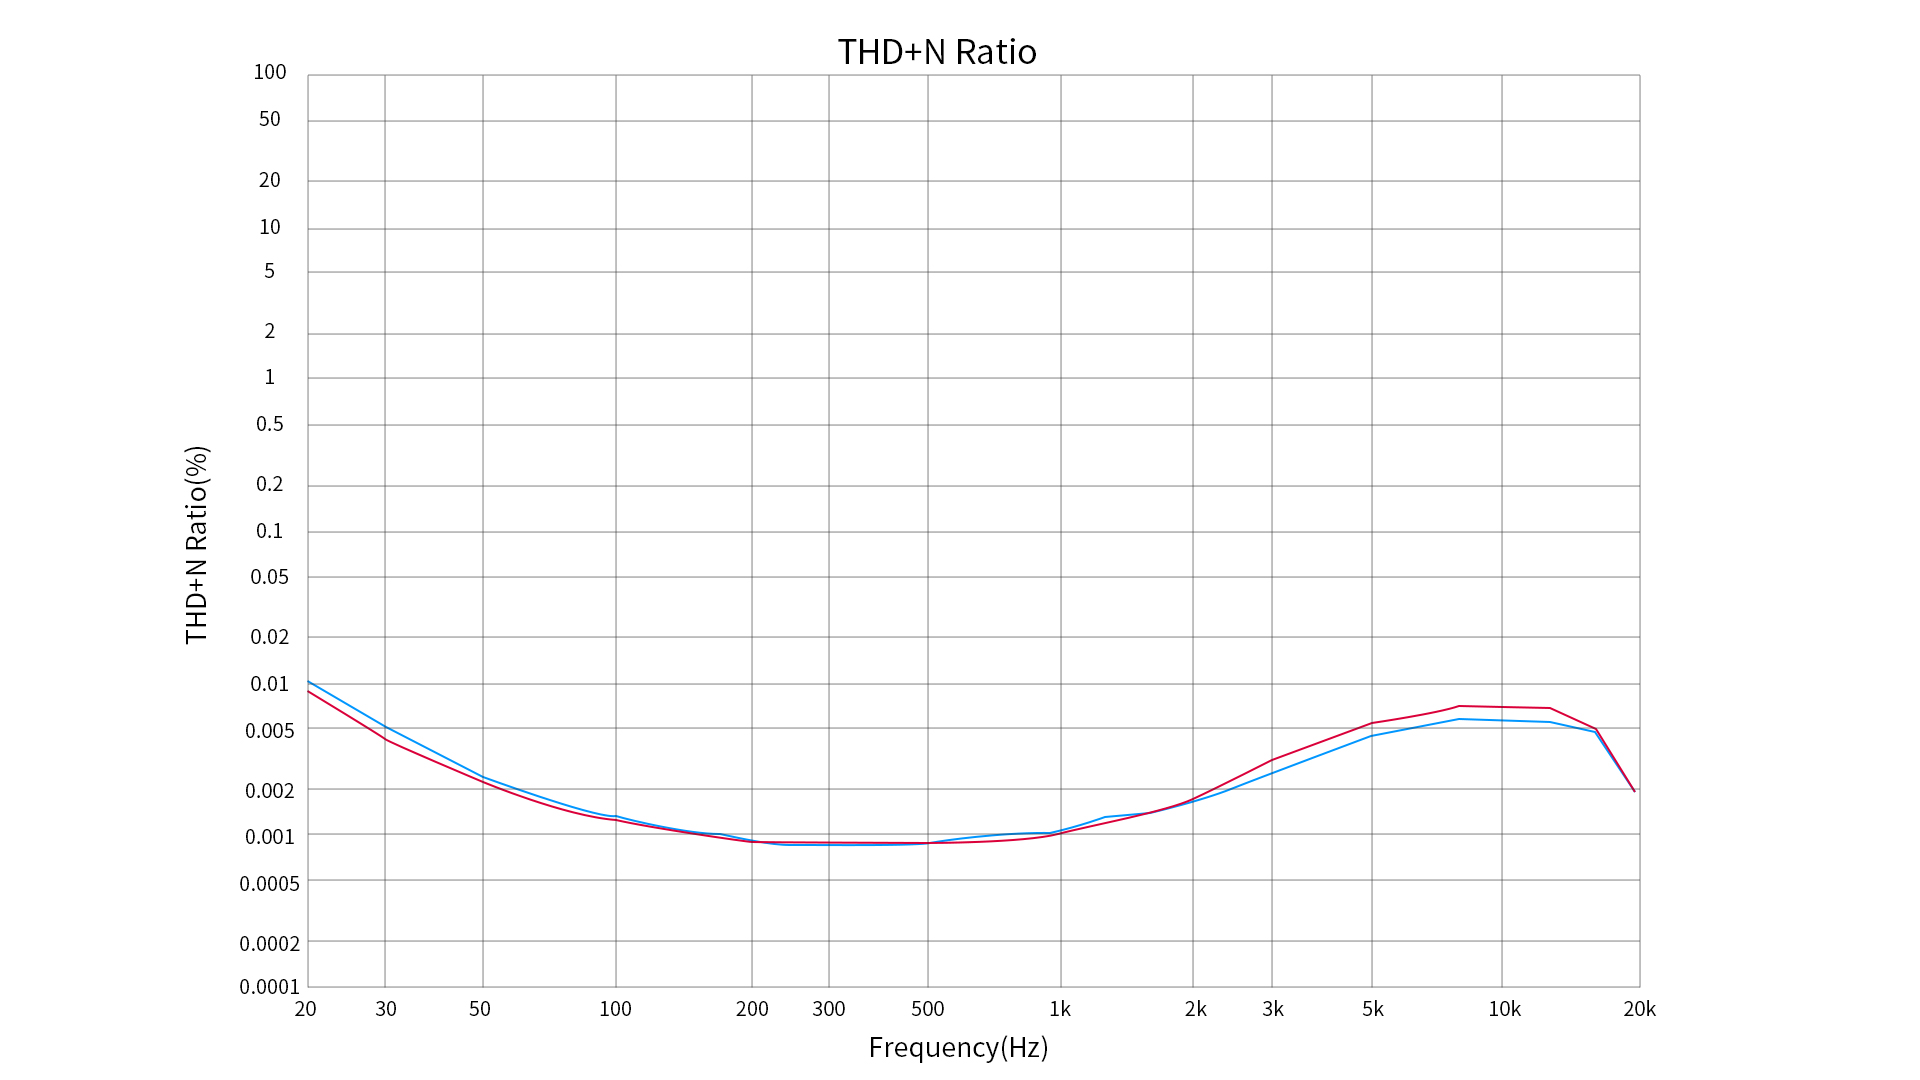
distortion graph 1
Test condition: USB DAC, play-6dB high gain sinusoidal signal, 20Hz-20kHz,PO output (32 Ω load)
frequency response curve 5
Test conditions: Line IN input,-5dB sinusoidal signal, 20Hz-20kHz, balanced output (32 Ω load)
Red: left channel; Blue: right channel